· Hakan Çelik · OpenCV / Advanced Topics · 5 dk okuma
Histograms
Histograms
Histograms - 1: Find, Plot, Analyze
( Histograms - 1 : Find, Plot, Analyze )
Goals
- Finding histograms using
OpenCVandNumpyfunctions. - Plotting histograms using
OpenCVandNumpyfunctions. - You will see these functions:
cv2.calcHist(),np.histogram(), etc.
Theory
What is a Histogram? You can consider it as a graph or plot, which gives you an overall idea of the intensity distribution of an image. It is a plot with pixel values (ranging from 0 to 255, not always) in the X-axis and corresponding number of pixels in the image on the Y-axis.
It is just another way of understanding the image. By looking at the histogram of an image, you get intuition about contrast, brightness, intensity distribution, etc. of that image. Today, almost all image processing tools provide features on histogram.
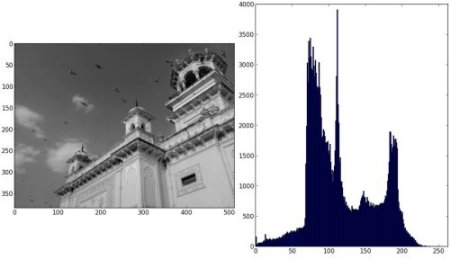
Below is an image from Cambridge Color website, and I recommend you to visit the website for more details.
You can see the image and its histogram ( remember, this histogram is drawn for grayscale image, not color image ).
In the left region of histogram, you can see darker pixels, and in the right region, brighter pixels.
From the histogram, you can see that darker regions are more than brighter regions, and the amount of midtones (pixel values in mid range, say around 127) are very less.
Finding Histograms
Now we learned what histogram is; we can look into how to find the histogram. Both OpenCV and Numpy come with built-in function for this.
1. Histogram Calculation Using OpenCV
Now we will use the cv.calcHist() function to find the histogram.
cv.calcHist(images, channels, mask, histSize, ranges[, hist[, accumulate]])
- images: It is the source image of type uint8 or float32. It should be given in square brackets, i.e., “[img]”.
- channels: It is also given in square brackets. It is the index of channel for which we calculate histogram. For example, if input is grayscale image, its value is [0]. For color image, you can pass [0], [1] or [2] to calculate histogram of blue, green or red channel respectively.
- mask: mask image. To find histogram of full image, it is given as None.
- histSize: this represents our BIN count. Needs to be given in square brackets. For full scale, [256] is passed.
- ranges: this is our RANGE. Normally, it is [0,256].
OK, let’s start with a sample example. Just load an image in grayscale mode and find its full histogram.
img = cv.imread('home.jpg',0)
hist = cv.calcHist([img],[0],None,[256],[0,256])
hist is a 256x1 array, each value corresponds to number of pixels in its corresponding pixel value.
2. Histogram Calculation Using Numpy
Numpy also provides a function for this, np.histogram(). So instead of calcHist() function, you can try the following line:
hist,bins = np.histogram(img.ravel(),256,[0,256])
hist is same as we calculated before. But bins will have 257 elements, because Numpy calculates bins as 0-0.99, 1-1.99, 2-2.99 etc. So final range would be 255-255.99.
To represent that, 256 is added to bins. But we don’t need that 256. Up to 255 is sufficient.
Also:
There is another function in Numpy, np.bincount(), which is much faster (10X) than np.histogram(). For one-dimensional histograms, you can try that. Don’t forget to set minlength = 256 in np.bincount.
For example,
hist = np.bincount(img.ravel(), minlength = 256)
Note:
The OpenCV function is 40X faster than np.histogram(), so use OpenCV.
Now we can plot histograms, but how? Of course with Matplotlib.
Plotting Histograms
There are two ways to do this
- Short way: with Matplotlib
- Long way: with OpenCV drawing functions
1- Plotting with Matplotlib
Matplotlib comes with a histogram plotting function: matplotlib.pyplot.hist()
This function directly finds the histogram and plots it. You need not use calcHist() or np.histogram() functions to find the histogram.
Check the following code:
import numpy as np
import cv2 as cv
from matplotlib import pyplot as plt
img = cv.imread('home.jpg',0)
plt.hist(img.ravel(),256,[0,256]); plt.show()
Or you can use matplotlib’s normal plot which would be good for BGR image. For that, you need to find the histogram data first.
Try the following code:
import numpy as np
import cv2 as cv
from matplotlib import pyplot as plt
img = cv.imread('home.jpg')
color = ('b','g','r')
for i,col in enumerate(color):
    histr = cv.calcHist([img],[i],None,[256],[0,256])
    plt.plot(histr,color = col)
    plt.xlim([0,256])
plt.show()
Result: 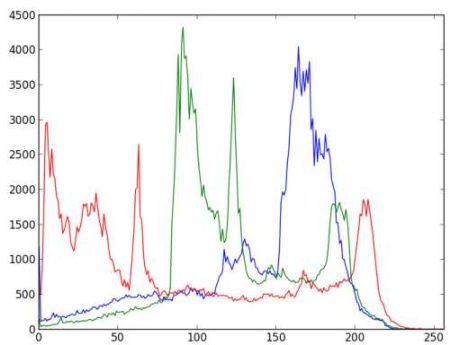
You can see from the above graph that the blue channel has some high value areas in the image (obviously it should be due to the sky).
2- Plotting Using OpenCV
Here you can adjust the histogram values along with its bin values to look like x,y coordinates so that you can draw it using cv.line() or cv.polyline() function to generate same image as above.
Applying Mask
We use cv.calcHist() to find the histogram of the full image. What if you want to find histograms of some regions of an image? Just create a mask image with white color on the region you want to find the histogram and black otherwise.
img = cv.imread('home.jpg',0)
# create a mask
mask = np.zeros(img.shape[:2], np.uint8)
mask[100:300, 100:400] = 255
masked_img = cv.bitwise_and(img,img,mask = mask)
# Calculate histogram with and without mask
# Check third argument for mask
hist_full = cv.calcHist([img],[0],None,[256],[0,256])
hist_mask = cv.calcHist([img],[0],mask,[256],[0,256])
plt.subplot(221), plt.imshow(img, 'gray')
plt.subplot(222), plt.imshow(mask,'gray')
plt.subplot(223), plt.imshow(masked_img, 'gray')
plt.subplot(224), plt.plot(hist_full), plt.plot(hist_mask)
plt.xlim([0,256])
plt.show()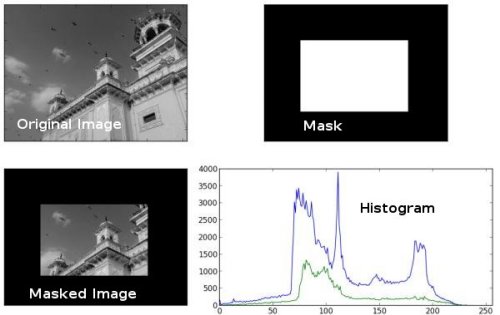
Additional Resource
Histograms - 2: Histogram Equalization
( Histograms - 2: Histogram Equalization )
Goals;
We will learn the concepts of histogram equalization and use it to improve the contrast of our images.
Translation reference: https://opencv-python-tutroals.readthedocs.io/en/latest/py_tutorials/py_imgproc/py_histograms/py_histogram_equalization/py_histogram_equalization.html