· Hakan Çelik · OpenCV / Feature Detection · 2 dk okuma
Shi-Tomasi Corner Detector & Good Features to Track
Shi-Tomasi Corner Detector & Good Features to Track
Goal
In this chapter,
- We will learn about the another corner detector: Shi-Tomasi Corner Detector
- We will see the function: cv.goodFeaturesToTrack()
Theory
In last chapter, we saw Harris Corner Detector. Later in 1994, J. Shi and C. Tomasi made a small modification to it in their paper Good Features to Track which shows better results compared to Harris Corner Detector. The scoring function in Harris Corner Detector was given by:
R = λ₁λ₂ - k(λ₁+λ₂)²
Instead of this, Shi-Tomasi proposed:
R = min(λ₁, λ₂)
If it is a greater than a threshold value, it is considered as a corner. If we plot it in λ₁ - λ₂ space as we did in Harris Corner Detector, we get an image as below:
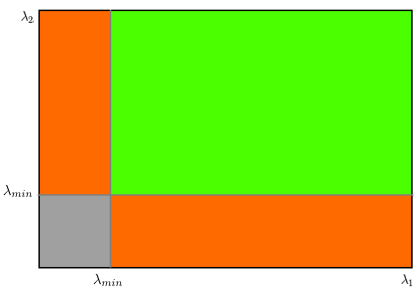
From the figure, you can see that only when λ₁ and λ₂ are above a minimum value, λ_min, it is considered as a corner (green region).
Code
OpenCV has a function, cv.goodFeaturesToTrack(). It finds N strongest corners in the image by Shi-Tomasi method (or Harris Corner Detection, if you specify it). As usual, image should be a grayscale image. Then you specify number of corners you want to find. Then you specify the quality level, which is a value between 0-1, which denotes the minimum quality of corner below which everyone is rejected. Then we provide the minimum euclidean distance between corners detected.
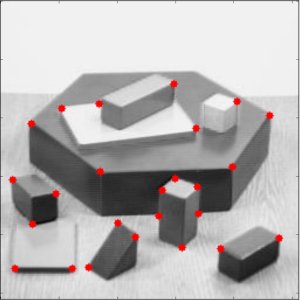
In below example, we will try to find 25 best corners:
import numpy as np
import cv2 as cv
from matplotlib import pyplot as plt

img = cv.imread('blox.jpg')
gray = cv.cvtColor(img, cv.COLOR_BGR2GRAY)

corners = cv.goodFeaturesToTrack(gray, 25, 0.01, 10)
corners = np.int0(corners)

for i in corners:
    x, y = i.ravel()
    cv.circle(img, (x, y), 3, 255, -1)

plt.imshow(img), plt.show()
See the result below:
This function is more appropriate for tracking. We will see that when its time comes.